Making the right decisions at the right time is crucial for business success. A flawed decision-making process and lack of visibility into your portfolio performance can lead to failed strategies. This is where the GE Matrix, also known as the McKinsey GE Matrix or Nine Box Matrix, comes in handy.
The McKinsey GE Matrix is an indispensable strategic framework used by leading corporations globally to systematically analyze their business portfolio and prioritize resource allocation and investments across products, services, and strategic business units (SBUs).

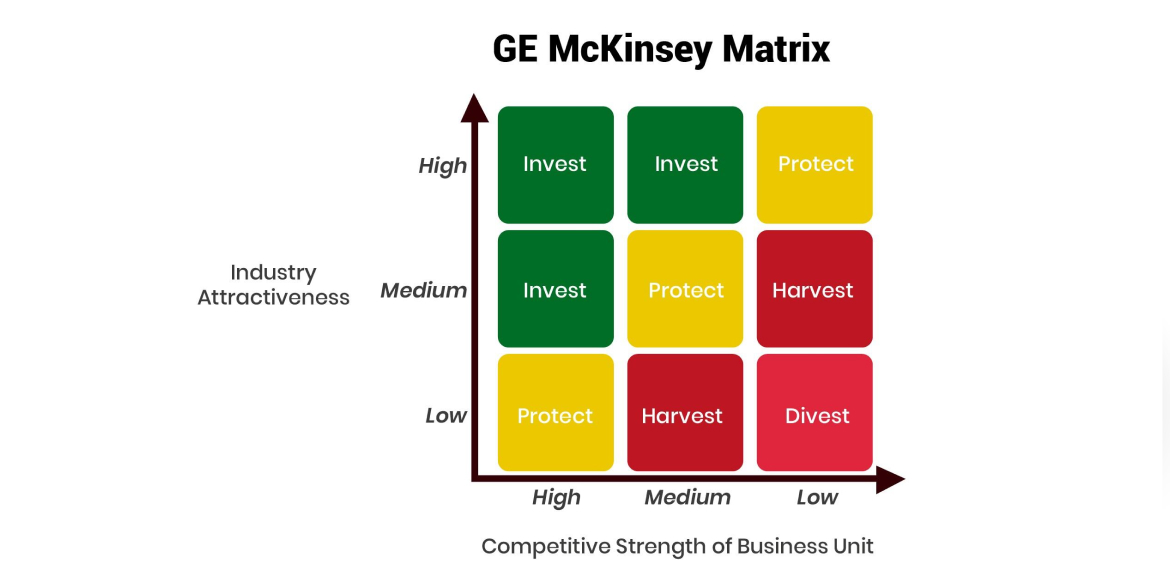
The GE McKinsey Matrix, developed in the 1970s, is a 3x3 grid that evaluates a firm’s offerings (product lines, services, business units etc.) based on two key dimensions:
By plotting each business unit in these dimensions, the GE Matrix enables companies to identify high-potential businesses worthy of further investment and expansion as well as problem areas requiring remedial action or divestment.
For instance, business units falling in the “High Attractiveness/High Strength” quadrant are stars deserving increased allocation of resources to reinforce their leadership position. On the opposite end, entities in the “Low Attractiveness/Low Strength” zone are dogs that are candidates for divestment.
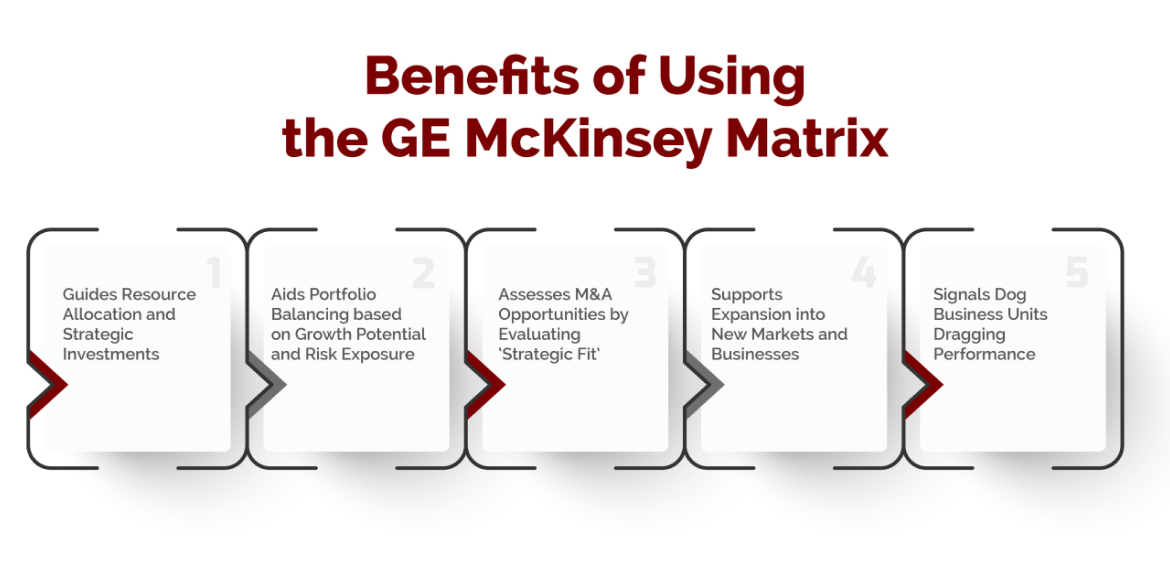
When used effectively, the matrix can deliver the following advantages:

One of the key benefits of the GE Matrix is that it guides resource allocation decisions and strategic investments. By visually mapping business units based on market attractiveness and competitive strength, the matrix clearly signals high potential areas that warrant further investment to drive growth.
Specifically, business units that fall in the high attractiveness/high strength quadrants emerge as prime candidates for receiving a greater share of resources. These units operate in fundamentally attractive markets and hold leading competitive positions within those markets. Allocating disproportionate investments towards these stars and cash cows allows companies to consolidate market leadership in the most promising industries.
Conversely, low attractiveness/low strength units represent either question marks with uncertain futures or dogs that are facing decline. The GE Matrix recommends limiting resource commitments towards these units or divesting them, freeing up funds for re-allocation to stronger business units.
The GE McKinsey matrix aids in balancing a company’s portfolio across different quadrants, ensuring an appropriate mix of business units based on their growth prospects and inherent risk levels.
Ideally, a company would like business units evenly spread across high growth, moderate growth and low growth buckets. Within each bucket, units would be balanced between high, medium and low market attractiveness. This ensures a healthy blend of fast growing business areas along with stable moderate growth and cash generating low growth units. Risks also get diversified instead of the entire portfolio being concentrated in uncertain, high growth domains.
The scatter plot visual enables executives to take a holistic view and recalibrate the distribution if required. For instance, acquiring fast growing companies can add units to high growth quadrants with low current share. Similarly, increased competitiveness can move strong units into higher market attractiveness tiers. Portfolio gaps become quickly apparent for mitigation.
By maintaining balance across various growth levels and market scenarios, companies create an agile, resilient portfolio capable of delivering sustained value across business cycles. Exposure gets minimized to market fluctuations or demand declines in any one business domain.
The GE McKinsey matrix plays a pivotal role in evaluating merger and acquisition opportunities. It enables assessment of ‘strategic fit’ - whether a potential target aligns with and enhances the acquiring company’s existing portfolio.
Plotted on the GE matrix, a target company’s positioning reveals if it occupies an attractive quadrant with high industrial growth and competitive strength. The strategic logic behind the acquisition also becomes clearer - it may fill portfolio gaps, increase presence in promising segments or deliver synergies with existing business units.
At the same time, the visualization quickly highlights risks such as acquisition of low strength units in unattractive industries. This could significantly enhance the portfolio’s vulnerability by increasing its exposure to poor performing business areas.
By revealing these facets of strategic fit, the GE Matrix becomes an invaluable tool during merger evaluation, target screening and due diligence. Companies gain better visibility on potential value creation or risk magnification arising from proposed acquisitions.
The GE McKinsey matrix aids companies seeking to expand into new markets and businesses, beyond their current product/service portfolio.
The market attractiveness assessment provides vital insights on industry profitability, competitiveness, trends and growth trajectories across a diverse range of sectors. This equips executives to identify fundamentally attractive industries aligned to the company’s capabilities and business strategy.
Similarly, evaluating the company’s potential competitive strength in new markets leverages existing competencies while revealing capability gaps needed to be closed. Resources can then be directed at building differentiated capabilities and assets over the long term to establish a robust market position.
This dual evaluation steers expansion plans towards the best fitting markets, balancing growth potential with competitive viability. Companies can systematically prioritize target industries, allocating resources at the most promising opportunities for successful diversification.
The GE matrix’s approach of screening out languishing business units acts as an early warning system for companies. Lagging units in low attractiveness/low strength quadrants signal significant adaptation needs or exit consideration to prevent them from dragging overall corporate performance.
Often, large conglomerates fail to prune marginal businesses in time due to sentimental attachments or an unwillingness to confront poor results. However, keeping cut off funding and ring-fencing weak units protects valuable resources being sunk into eventual failures.
By visually segregating the dogs from healthy business units, company leadership can drive tough portfolio choices aligned with market realities. Setting stringent improvement expectations along with restructuring, partnerships or divestment timelines brings objectivity into salvaging or pruning decisions.
While emotionally difficult, letting go of consistently underperforming units sets up the organization for better long term competitiveness and profitability. Companies unlock strategic freedom to pursue opportunities better positioned for value creation.
In essence, it enables multi-business organizations to invest smartly for sustained profitable growth.
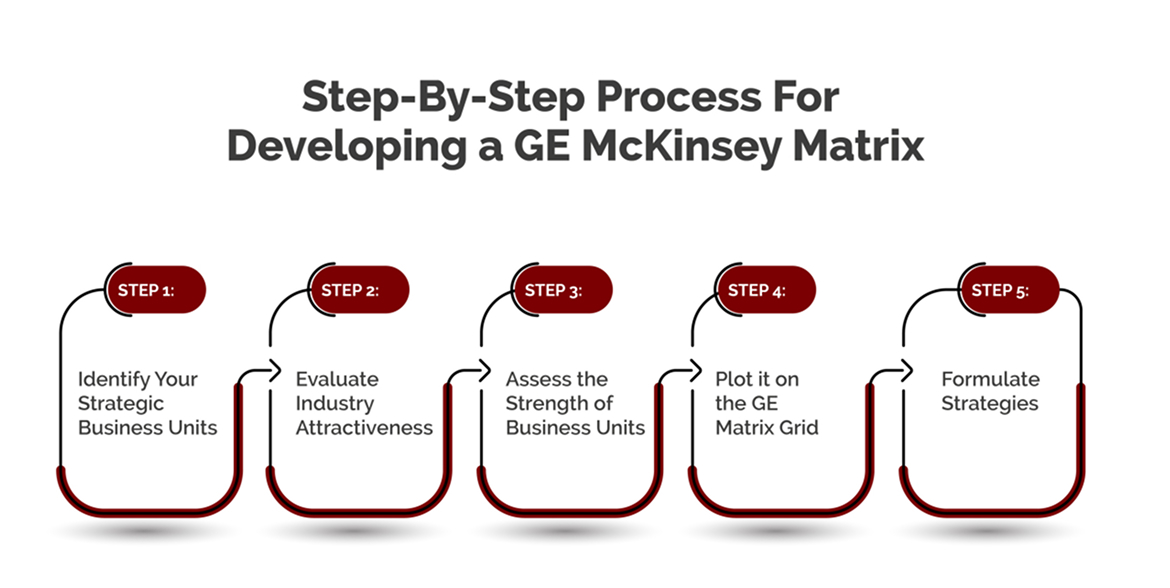
Now let us walk through the step-by-step process for developing a GE Matrix for your business:

First, identify the distinct businesses, product lines, brands or business units that need to be analyzed. Avoid evaluating at a too broad (entire company) or narrow level (single product). The apt level is strategic business units (SBUs).
Next, gauge the investment appeal of industries corresponding to each SBU by rating metrics like:
Assign a score (1-10) to each factor and calculate the overall industry attractiveness score for every SBU.
With industry attractiveness completed, evaluate every strategic business unit on criteria determining their competitive position within the industry:
Again, rate each factor and compute aggregated scores reflecting overall strength.
With scores on industry attractiveness and business unit strength for each SBU, you can plot them on the 3x3 GE matrix.
The units placed in the High-High zone emerge as ‘Stars’ poised for market dominance. The ones in the Low-Low area are ‘Dogs’ that are candidates for divestment. The middle zone consists of ‘Cash Cows’ with profitable offerings in slow-growth industries and ‘Question Marks’ that show promise but need specialized strategies.
The final step lies in devising tailored strategies for each SBU based on their position in the matrix:
Also assess synergies between business units to strengthen organizational performance. Review periodically as industry and competitive dynamics shift over time.
While indispensable, the GE matrix has some limitations too:
While the GE Matrix offers useful strategic insights, it is not sufficient as a standalone tool on which to base major investment decisions. The two-dimensional analysis, while robust, provides a snapshot of the business portfolio. Additional techniques are needed to supplement the results.
Some complementary analyses that can augment the GE Matrix include:
Therefore, the GE Matrix is best utilized as part of a comprehensive strategic planning process, rather than a solo framework. The matrix yields crucial portfolio-level insights, which then need to be investigated in detail through additional methodologies before strategic choices are finalized.
A notable limitation of the GE Matrix is the subjective, qualitative evaluation of some key matrix parameters, including:
Rating qualitative elements necessarily relies considerably on individual judgment. This brings in risks of personal bias, halo effects, recency bias, and scale perception issues interfering with the analysis.
For instance, an overestimation of competitive strength based on a recent product success can skew business unit positioning considerably to the right. Similarly, if industry attractiveness criteria weigh too heavily on only short-term profitability rather than long-term dynamics, the vertical placement may be distorted.
Such subjective evaluations can therefore undermine the matrix’s integrity. It takes concerted cross-functional collaboration and objective data analysis to minimize this limitation. External perspective from consultants also adds valuable neutrality.
The major issue with any strategic analytical model is that the real world keeps changing, while the framework provides only a static representation at a point in time. Industry conditions and competitive positions evolve rapidly.
The GE matrix thus has to be regularly reviewed and updated to remain a relevant decision-making tool. Constructing the matrix is resource-intensive, but leaving it unchanged for long renders it obsolete.
For most corporations, refreshing the business portfolio analysis on the GE matrix at least once every 6 to 12 months is imperative. For volatile sectors like technology, reviewing every quarter may be warranted to capture market shifts. While recalibration requires effort, regular updates provide the payoff of keeping strategic actions aligned with external realities.
Critics point out that the GE matrix takes a siloed view, mapping each business unit as an independent entity with distinct industry and market position. However, in reality, business units often have substantial interdependencies and synergies.
Important cross-BU relationships like shared platforms & technologies, joint distribution models, and combined operations are not captured in the matrix. This makes optimizing the corporate portfolio difficult since choices for one BU have ripple effects for others.
Unless the interrelationships are analyzed separately through approaches like synergy mapping, the GE matrix overlooks potential value-creation through BU collaboration. Companies risk suboptimal investment allocations and negative strategic externalities. Evaluating coordination possibilities across BUs is essential.
A basic conceptual limitation of the GE matrix lies in its two-dimensional framework—industry attractiveness along one axis and competitive strength along the other. This binary classification forces a complex multi-faceted business landscape into four or nine boxes.
Such simplification misses nuances between business units which face similar broad market conditions but highly distinct segmentation, value-drivers, success factors, and stakeholder expectations. Limiting assessment to only attractiveness and strength metrics overlooks several pivotal performance aspects.
Additional evaluation dimensions like manufacturing economies, innovation pipelines, operational risks, channel ecosystems, cultural alignments and talent availability likely impact most investment decisions.
While comprehensiveness gets challenging, incorporating such additional dimensions is key to preventing oversimplified judgments. Common extensions include market growth as a third axis or specific branch variants like the Shell Directional Policy Matrix targeted at the oil industry.
Therefore, organizations must utilize it as one input among many others while crafting strategy rather than the only approach. It needs to be embedded within comprehensive processes damned by rich analytics, competitive intelligence, consumer insights and expert judgment.
The GE McKinsey Matrix is an invaluable, versatile framework enabling multi-business corporations to take a hard look at their portfolio offerings and strategically prioritize resource allocation and investments.
Powered by incisive analysis and clarity of thought, the matrix can catalyze growth opportunities while mitigating risks through diversification. However, business leaders need to be fully aware of its limitations too, and incorporate it as part of a holistic strategic planning activity rather than an isolated tool.
When deployed effectively by business strategists seeking data-backed decisions, the GE Matrix can illuminate pathways to sustained competitive advantage and market leadership.

CredBadge™ is a proprietary, secure, digital badging platform that provides for seamless authentication and verification of credentials across digital media worldwide.
CredBadge™ powered credentials ensure that professionals can showcase and verify their qualifications and credentials across all digital platforms, and at any time, across the planet.

Keep yourself informed on the latest updates and information about business strategy by subscribing to our newsletter.